Bookmark it before you forget — learn more efficiently in the app!
Tools · Range
Poker Preflop Range Chart | 6-max 100BB Starting Hands
Browse a free preflop range chart by position on a 13×13 grid. Save the canonical NL50 6-max 100BB BTN open range as SVG, PNG, or PDF.
Save and share the canonical preflop range
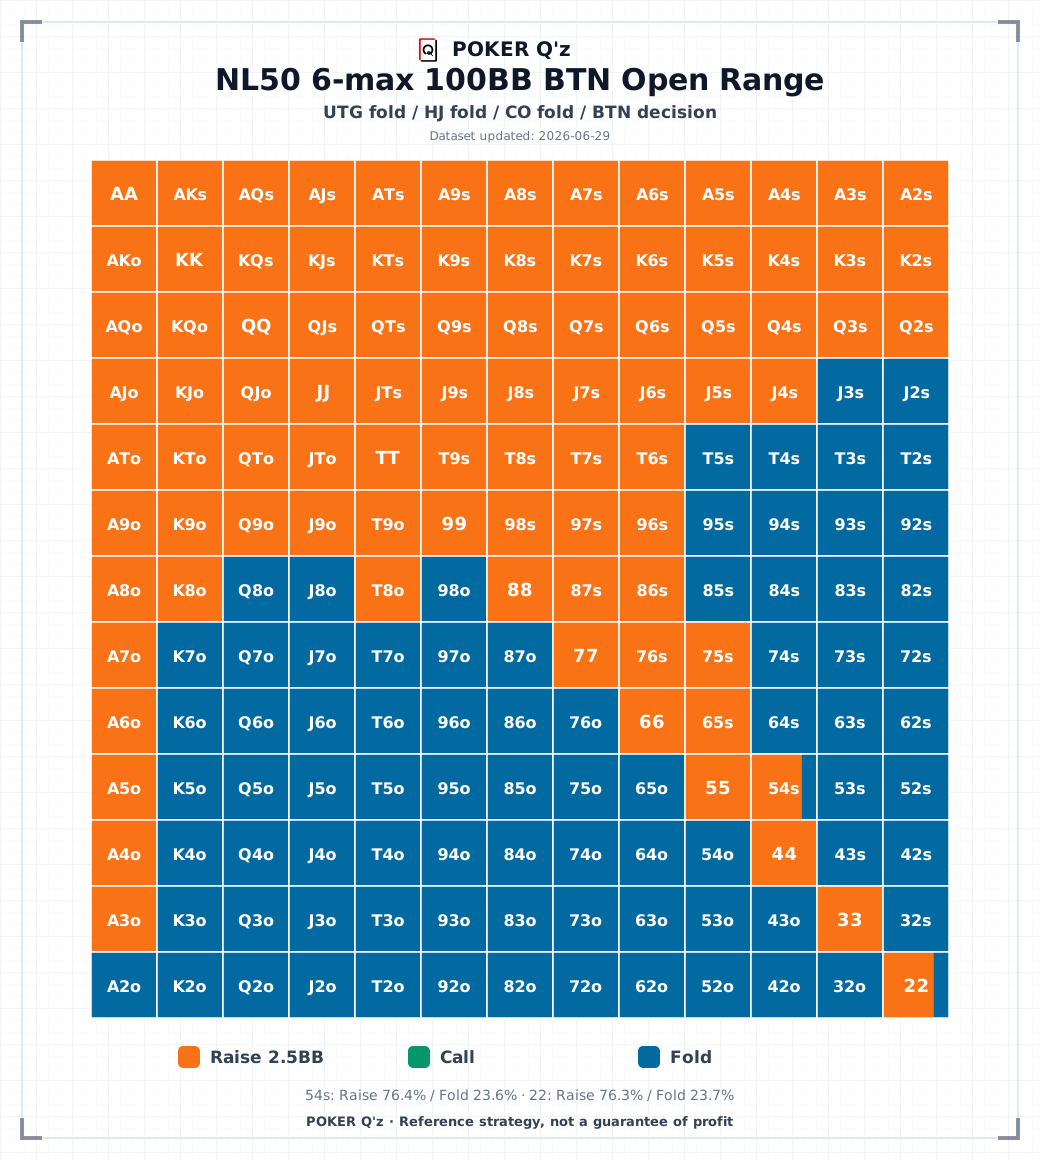
Canonical NL50 6-max cash 100BB after UTG, HJ, and CO fold. Exact combo-weighted Raise 2.5BB / Call / Fold frequencies across all 169 classes.
Range charts by position
View the GTO range chart for each position and situation on its own page.
Cash Games
Facing a 3-bet
Tournament (MTT)
Connect the preflop range chart to real decisions
A 6-max 100BB range is easier to use when you pair it with hand rankings, probabilities, and an equity check. Start from the chart, then review spots where the next action is unclear.
App · My Range
Your play becomes a color-coded range chart
In the app’s Analysis tab “My Range Chart”, hands you play in Fast Fold and AI matches are painted onto a 13×13 grid. Compare them with this GTO chart to spot biases like opening too wide or folding too tight—from your real data.
FAQ
- Are these preflop charts free?
- Yes. Every GTO preflop chart on this page is free to use, with no account or sign-up required.
- How do cash games differ from tournaments?
- You can switch between cash-game and MTT ranges. Because stack depths and blind structures differ, recommended ranges can change even at the same position.
- How do I read the 13×13 grid?
- Axes are ranks (A–2). The diagonal is pairs; the upper-right is suited and the lower-left is offsuit. Colors show action mix (raise, call, etc.).
- Should I always follow this range?
- These are GTO baseline ranges. In practice, adjust for opponent tendencies and table flow. Learn them as a standard, then deviate intentionally.